Note: If you cannot see the Dashboard view in your Abler account, it may need to be enabled for you.
Please contact us at abler@abler.io and we’ll activate it for you.
The Club Dashboard in Abler gives you a complete overview of your club’s data and performance across different programs and divisions. It helps you track growth, monitor engagement, and gain insights into who your members are.
You can download all data from the dashboard directly to an Excel file for further analysis.
Accessing the Dashboard
Go to the left-hand menu and select Dashboard under your organization name.
Choose the relevant view, for example:
Members
Member Profile
Players at Risk
Members Tab
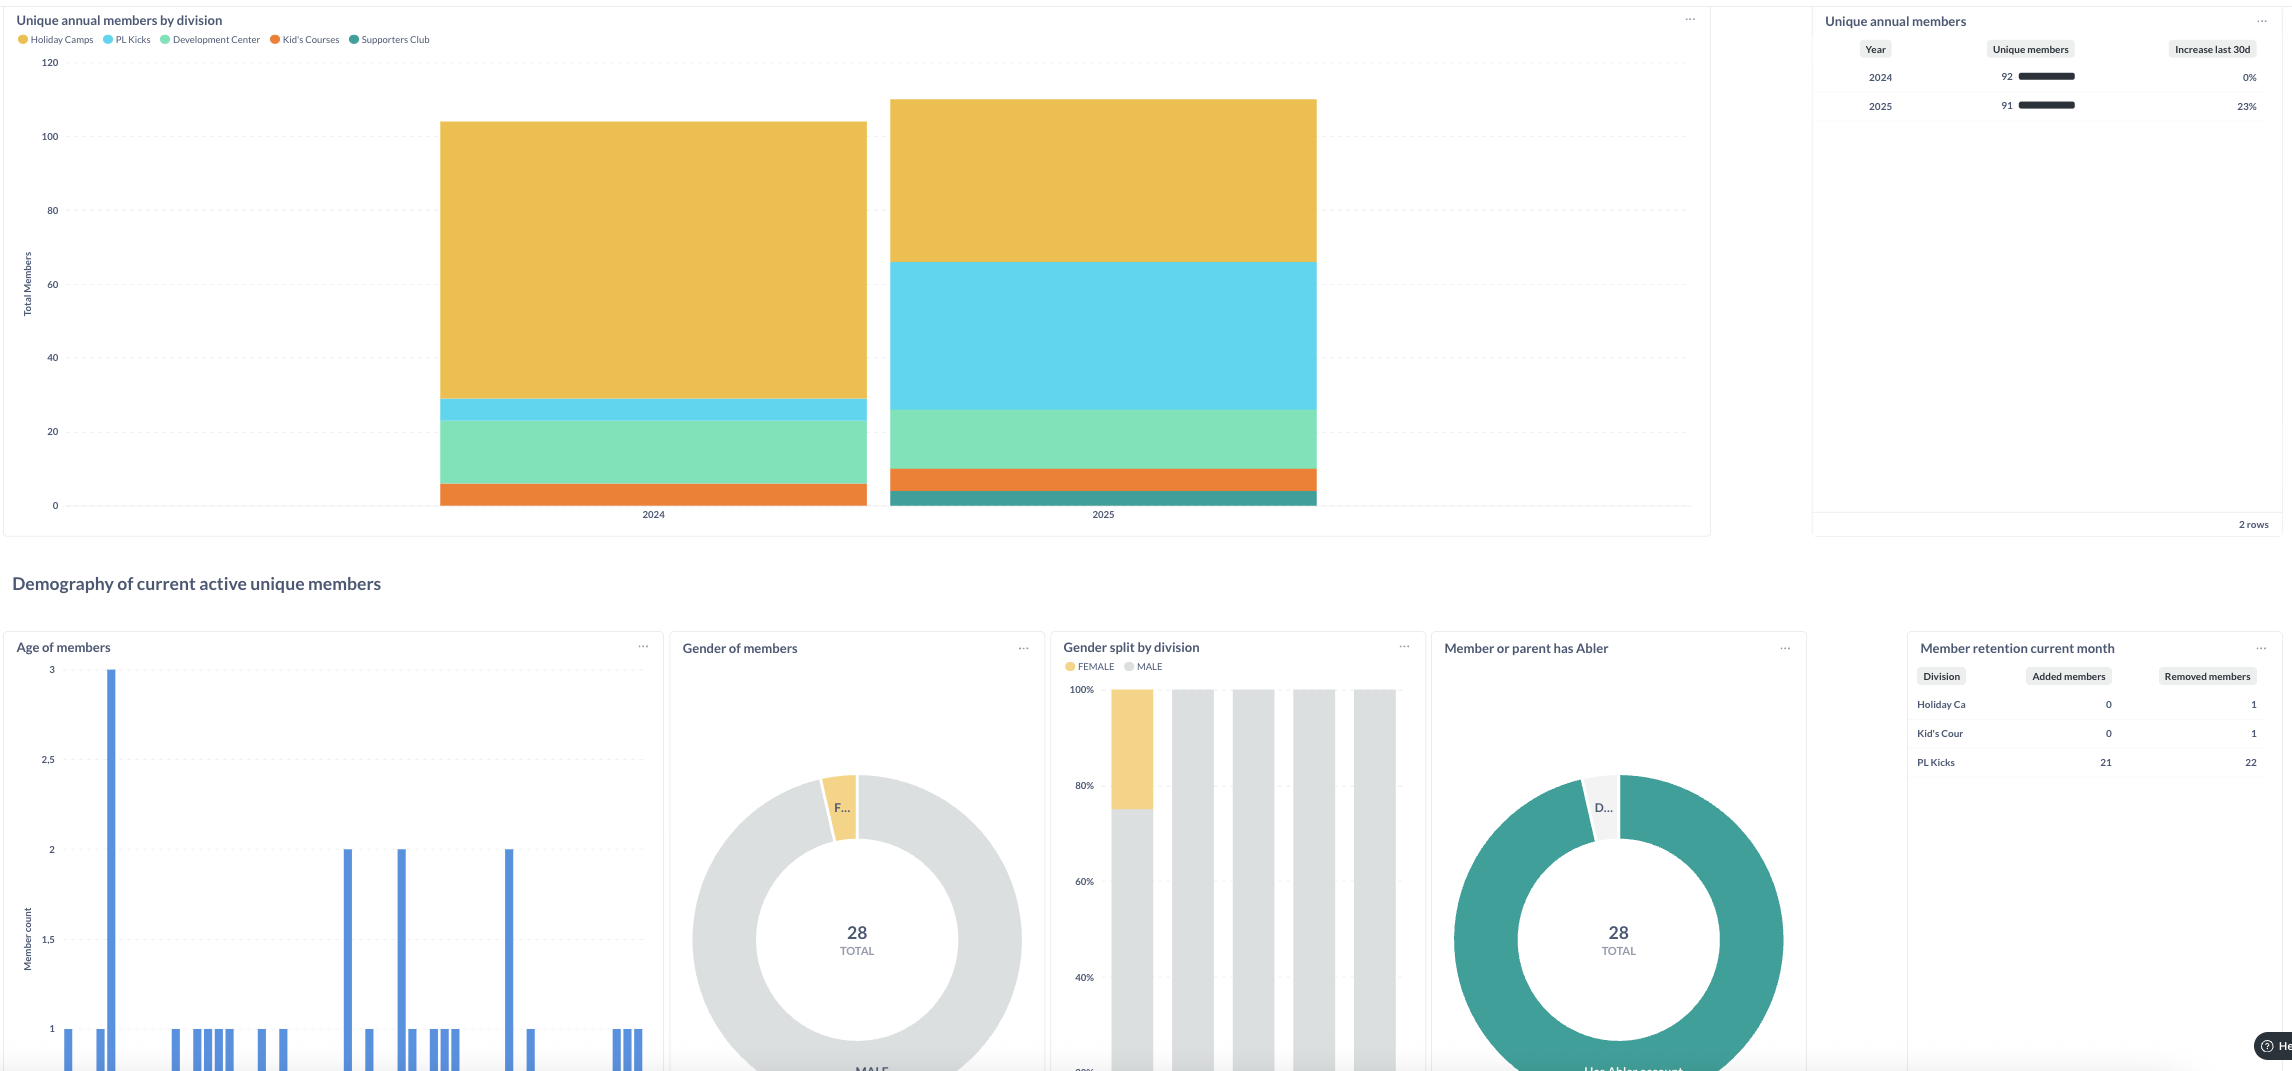
The Members tab provides an overview of current and historical member activity.
Key sections include:
Member Statistics – Shows trends in member numbers across divisions such as Holiday Camps, PL Kicks and Development Center.
Cumulative Member Count by Year – Displays total unique members per year and growth over time.
Current Month’s Members – A visual breakdown of active members by division.
Unique Annual Members – Tracks yearly totals and recent growth percentages.
and more...Gender and Age - A breakdown of the age and gender of your members.
Member Profile Tab
The Member Profile view in the dashboard displays data collected from your club’s Member Profile Questions — including details such as ethnicity, medical conditions, addresses, multiple deprivation index, and more.
To set up or edit your Member Profile Questions, please refer to this article:
Member Profile Questions
Players at Risk Tab
This section identifies members who may be at risk of leaving. It helps you take proactive steps to improve retention by reviewing their attendance and engagement data.
Enrolments Overview
You’ll also find quick statistics showing:
Last 24 hours enrolments
Last 30 days enrolments
Number of live programs
These figures help you monitor how well your programs are performing and how many members are actively joining.
Data Breakdown
The data breakdown tables at the bottom of the dashboard allow you to explore:
Age distribution across programs
Postal code clusters
Other data points that help you understand where your members come from and which programs are growing.